웹사이트 속도 측정을 이야기할 때 흔히 두 부류로 갈립니다. 하나는 Lighthouse 점수에만 매달리는 팀입니다. 다른 하나는 window.performance 숫자 몇 개만 보고 "원인은 다 찾았다"라고 결론내리는 팀이죠. 둘 다 반만 맞습니다.
Lighthouse는 실험실 데이터에 강합니다. 배포 전후 비교도 쉽고, 무거운 이미지, 불필요한 JavaScript, 렌더링을 막는 리소스를 빠르게 잡아냅니다. 반대로 Window Performance API는 브라우저 안에서 실제로 무슨 일이 벌어지는지 보여줍니다. 어느 리소스가 느린지, 첫 화면이 언제 보이는지, 화면은 떴지만 메인 스레드가 여전히 바쁜지 같은 것들입니다.
이 둘을 같이 봐야 비로소 "느린 것 같다" 수준에서 벗어납니다. 특히 SEO에서는 더 그렇습니다. LCP가 늦고, 인터랙션이 굼뜨고, 레이아웃이 흔들리면 사용자는 바로 이탈합니다. 검색엔진도 그런 페이지를 좋아하지 않습니다.
왜 두 도구를 함께 봐야 할까
Lighthouse는 URL 하나를 빠르게 평가하기에 아주 좋습니다. 다만 실제 사용 환경 전체를 대신해 주지는 못합니다. 사용자들은 사무실 와이파이와 고성능 노트북만 쓰지 않습니다. 중저가 안드로이드 기기, 불안정한 LTE, 서드파티 스크립트, 쿠키 배너, 느린 웹폰트까지 다 섞여 있습니다.
window.performance를 보면 질문 자체가 달라집니다.
- 병목이 초기 HTML 응답에 있나, 아니면 외부 스크립트에 있나?
- 히어로 영역이 늦게 뜨는 이유가 이미지 때문인가, 폰트 때문인가, 렌더 차단 때문인가?
- 화면은 떴는데 왜 클릭 반응은 여전히 버벅거리나?
이런 질문에 답할 수 있어야 진짜 최적화가 시작됩니다.
Lighthouse는 점수보다 리포트를 읽어야 한다
가장 쉬운 방법은 Chrome DevTools입니다. 페이지를 열고 F12를 누른 뒤 Lighthouse 탭에서 Mobile 또는 Desktop을 선택하고 분석을 돌리면 됩니다. 빌드별 비교나 자동화가 필요하면 CLI까지 연결하면 되고요.
브라우저를 열기 전에 SEO Analyzer로 URL을 먼저 훑어보는 것도 괜찮습니다. 성능과 모바일 사용성에서 어디가 먼저 의심스러운지 감을 잡는 데 도움이 됩니다.

여기서 중요한 건 총점보다 세부 항목입니다. 실제로 문제를 만드는 건 보통 이런 것들입니다.
- 사용되지 않는 JavaScript
- 렌더링을 막는 CSS 또는 스크립트
- 모바일 첫 화면에 너무 무거운 이미지
- TBT를 밀어 올리는 서드파티 코드
점수를 자랑하려고 쓰는 도구가 아니라, 어디부터 손대야 할지 정하는 도구라고 보면 편합니다.
먼저 볼 만한 지표는 무엇인가
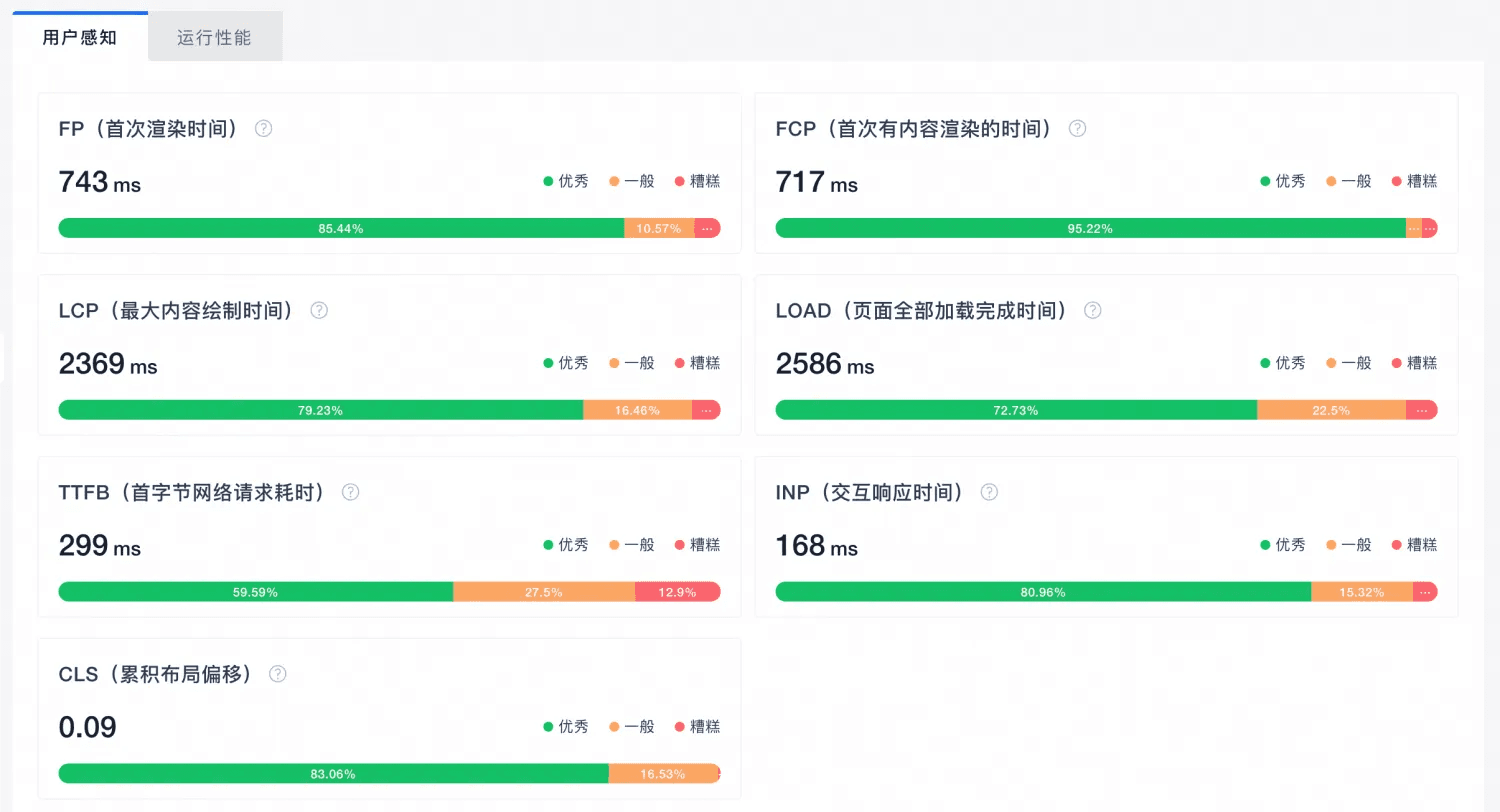
모든 약어를 외울 필요는 없습니다. 실무에서는 아래 지표부터 보면 충분합니다.
- LCP: 가장 중요한 화면 요소가 언제 보이는지.
- INP: 클릭이나 터치 후 페이지가 얼마나 빨리 반응하는지.
- CLS: 레이아웃이 로딩 중 얼마나 흔들리는지.
- FCP: 빈 화면이 언제 끝나는지.
- TBT: 실험실 환경에서 메인 스레드 블로킹을 읽기 좋은 지표.
예전 글에서는 TTI나 FID를 많이 다룹니다. 맥락을 이해하는 데는 도움이 되지만, 지금 우선순위를 정할 때는 LCP, INP, CLS, TBT 쪽이 훨씬 실전적입니다.
Window Performance API가 더 잘 보여 주는 것들
이제부터는 표면적인 점수보다 원인 추적에 가까워집니다.
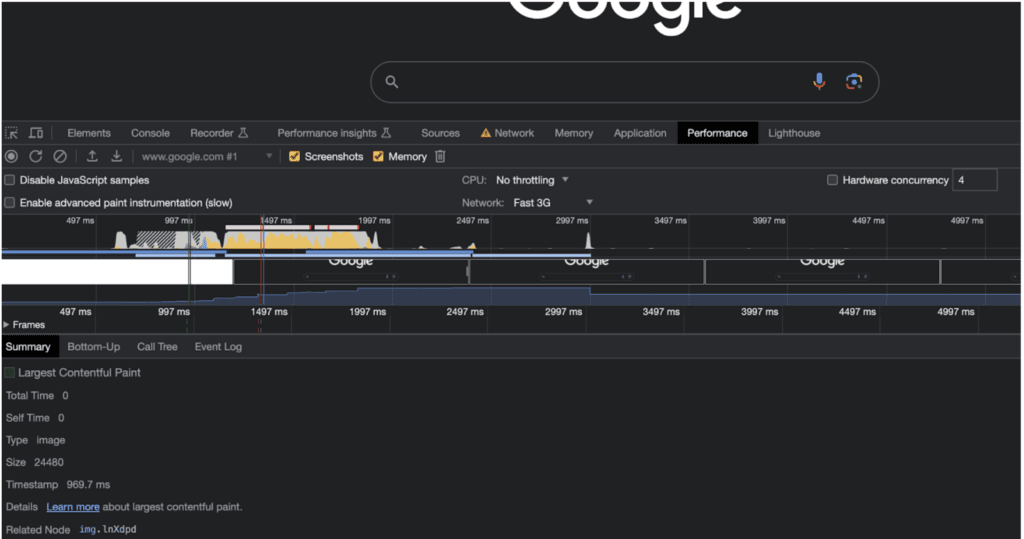
performance.getEntriesByType('navigation')로는 내비게이션 타이밍을 볼 수 있고, resource로는 느린 파일을 찾을 수 있습니다. paint는 화면이 실제로 언제 그려졌는지 확인할 때 유용합니다. LCP, CLS, long task처럼 최신 지표를 더 세밀하게 보려면 PerformanceObserver를 쓰는 편이 낫습니다.
1const nav = performance.getEntriesByType('navigation')[0];
2const resources = performance.getEntriesByType('resource');
3
4console.log('DOMContentLoaded:', nav.domContentLoadedEventEnd);
5console.log('Load event:', nav.loadEventEnd);
6console.log(
7  'Top 5 slowest resources:',
8  resources.sort((a, b) => b.duration - a.duration).slice(0, 5)
9);
1const observer = new PerformanceObserver((list) => {
2  for (const entry of list.getEntries()) {
3    console.log(entry.entryType, entry.startTime, entry.duration || entry.value);
4  }
5});
6
7observer.observe({ type: 'largest-contentful-paint', buffered: true });
8observer.observe({ type: 'layout-shift', buffered: true });
9observer.observe({ type: 'longtask', buffered: true });
INP를 운영 환경에서 제대로 수집하려면 자체 RUM 파이프라인이나 web-vitals 계열 구현에 연결하는 편이 안전합니다. 그냥 콘솔 몇 줄로 끝낼 수 있는 문제는 아닙니다.

네트워크 조건을 바꿔 가며 비교해 보면 민낯이 드러납니다. 와이파이에서는 멀쩡해 보이던 페이지가 Fast 3G만 걸어도 갑자기 느려지는 경우가 생각보다 많습니다.
실무에서 먹히는 점검 순서
복잡한 절차가 꼭 좋은 절차는 아닙니다. 아래 정도면 충분히 강합니다.
- Lighthouse로 위험한 페이지를 먼저 가려낸다.
window.performance로 어떤 리소스와 어떤 타이밍이 문제인지 좁힌다.- 필드 데이터나 Search Console과 대조해서 실제 사용자 영향까지 확인한다.
- 수정한 뒤 같은 기기, 같은 네트워크 조건으로 다시 측정한다.
무거운 에셋이 주범이라면 배포 전에 JavaScript Compressor, CSS Compressor, HTML Compressor로 불필요한 용량부터 줄여 볼 수 있습니다.
마무리
좋은 성능 테스트는 "점수가 몇 점 나왔는가"에서 끝나면 안 됩니다. 왜 느린지, 어느 계층이 병목인지, 어떤 수정이 가장 큰 효과를 주는지까지 설명할 수 있어야 합니다.
Lighthouse는 빠르게 경고를 줍니다. Window Performance는 그 경고를 근거 있는 진단으로 바꿔 줍니다. 먼저 전체 상태를 훑고 싶다면 SeoSpeedup에서 URL을 점검한 다음, 그 결과를 기반으로 브라우저 레벨 분석으로 내려가 보세요.